A new UK Biobank paper on omega‑6 and adiposity just landed, and if you only read the abstract, you’d think the story was simple: higher linoleic acid (LA) in plasma is “protective” against obesity and therefore we should be recommending more LA‑rich oils to everyone.
Look one level deeper, and you get a very different picture – one that actually fits beautifully with what we already know about desaturase activity, arachidonic acid (AA), and endocannabinoid tone.
This post walks through what the study actually shows, why the “more LA is better” inference is shaky, and how an ECS‑centric view reframes the whole thing.
What the UK Biobank linoleic acid study actually found
The authors used data from >270,000 UK Biobank participants with plasma fatty‑acid profiles and detailed anthropometrics. They looked at:
-
Exposures
-
Plasma linoleic acid (LA) (% of total fatty acids)
-
Non‑LA omega‑6 = total omega‑6 − LA (i.e., AA, DGLA, GLA, adrenic, Osbond)
-
Total omega‑6 as a secondary exposure
-
-
Outcomes
-
Waist circumference
-
Weight
-
Whole‑body fat mass (bioimpedance)
-
Plus secondary metrics (BMI, trunk fat, fat‑free mass)
-
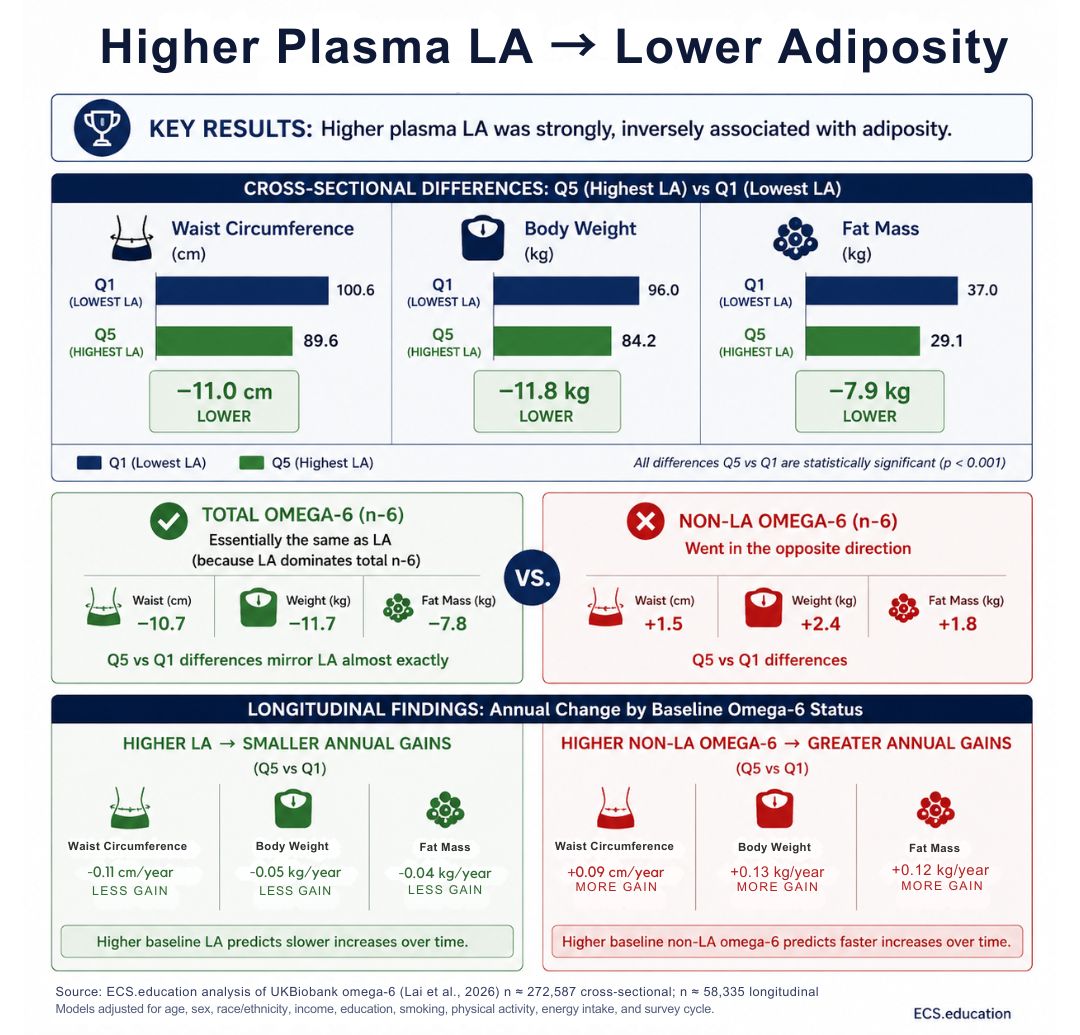
They ran multivariable linear models cross‑sectionally (n ≈ 272k) and longitudinally (n ≈ 58k with follow‑up), adjusting for age, sex, SES, physical activity, and DHA, among others.
Key results
Higher plasma LA was strongly, inversely associated with adiposity.
- Q5 vs Q1 LA:
- Waist −11.0 cm
- Weight −11.8 kg
- Fat mass −7.9 kg
Total omega‑6 looked essentially the same as LA (because LA dominates total n‑6).
Non‑LA omega‑6 went in the opposite direction:
- Q5 vs Q1 non‑LA:
- Waist +1.5 cm
- Weight +2.4 kg
- Fat mass +1.8 kg
Longitudinally, higher LA predicted smaller annual gains in waist, weight, fat mass; non‑LA omega‑6 predicted greater gains.
Their conclusion: higher LA “potentially supports dietary recommendations to promote LA‑rich oils,” and we shouldn’t treat all omega‑6 as homogeneous.
The second part is right. The first part is where things go off the rails.
Plasma linoleic acid vs non‑LA omega‑6: two very different signals
Let’s start with the obvious: plasma LA is not where the main toxicity lives. No one seriously thinks micromolar LA in plasma is the direct driver of adipocyte hypertrophy. The business end of omega‑6 pathology sits downstream:
- Arachidonic acid (AA) in tissue phospholipids
- AA‑derived eicosanoids (prostaglandins, leukotrienes, thromboxanes)
- AA‑derived endocannabinoids and NAEs feeding chronic CB1 activation
Those are not measured here. We only see their proxy: the non‑LA omega‑6 fraction in plasma, which goes up with adiposity.
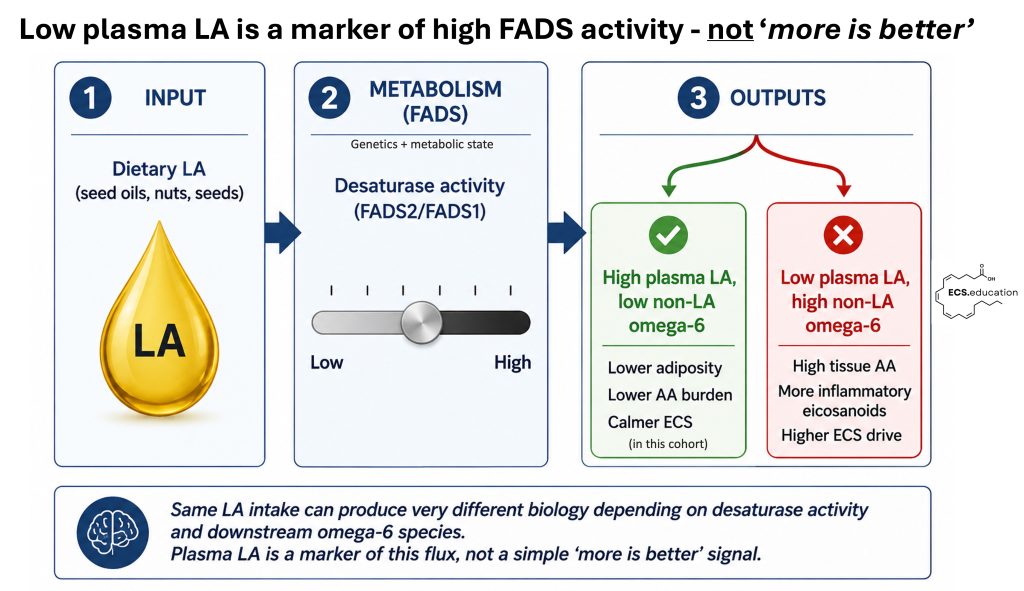
What the authors have actually rediscovered is a desaturase phenotype:
- High plasma LA + low non‑LA omega‑6
→ lower estimated FADS2/FADS1 flux, lower AA burden, better metabolic profile, less adiposity. - Low plasma LA + high non‑LA omega‑6
→ high desaturase activity, more AA and its cousins, more inflammation and metabolic stress, more adiposity.
The UK Biobank data fit this pattern perfectly. Leaner people have a plasma FA pattern that says, “I’m not aggressively converting LA into AA.” Heavier, more adipose individuals show the opposite.
So far, so good.
The leap the authors then make is: because high LA correlates with lower adiposity, we should encourage more LA intake for everyone. That’s where mechanistic sanity needs to kick in.
Plasma linoleic acid vs non‑LA omega‑6: two very different signals
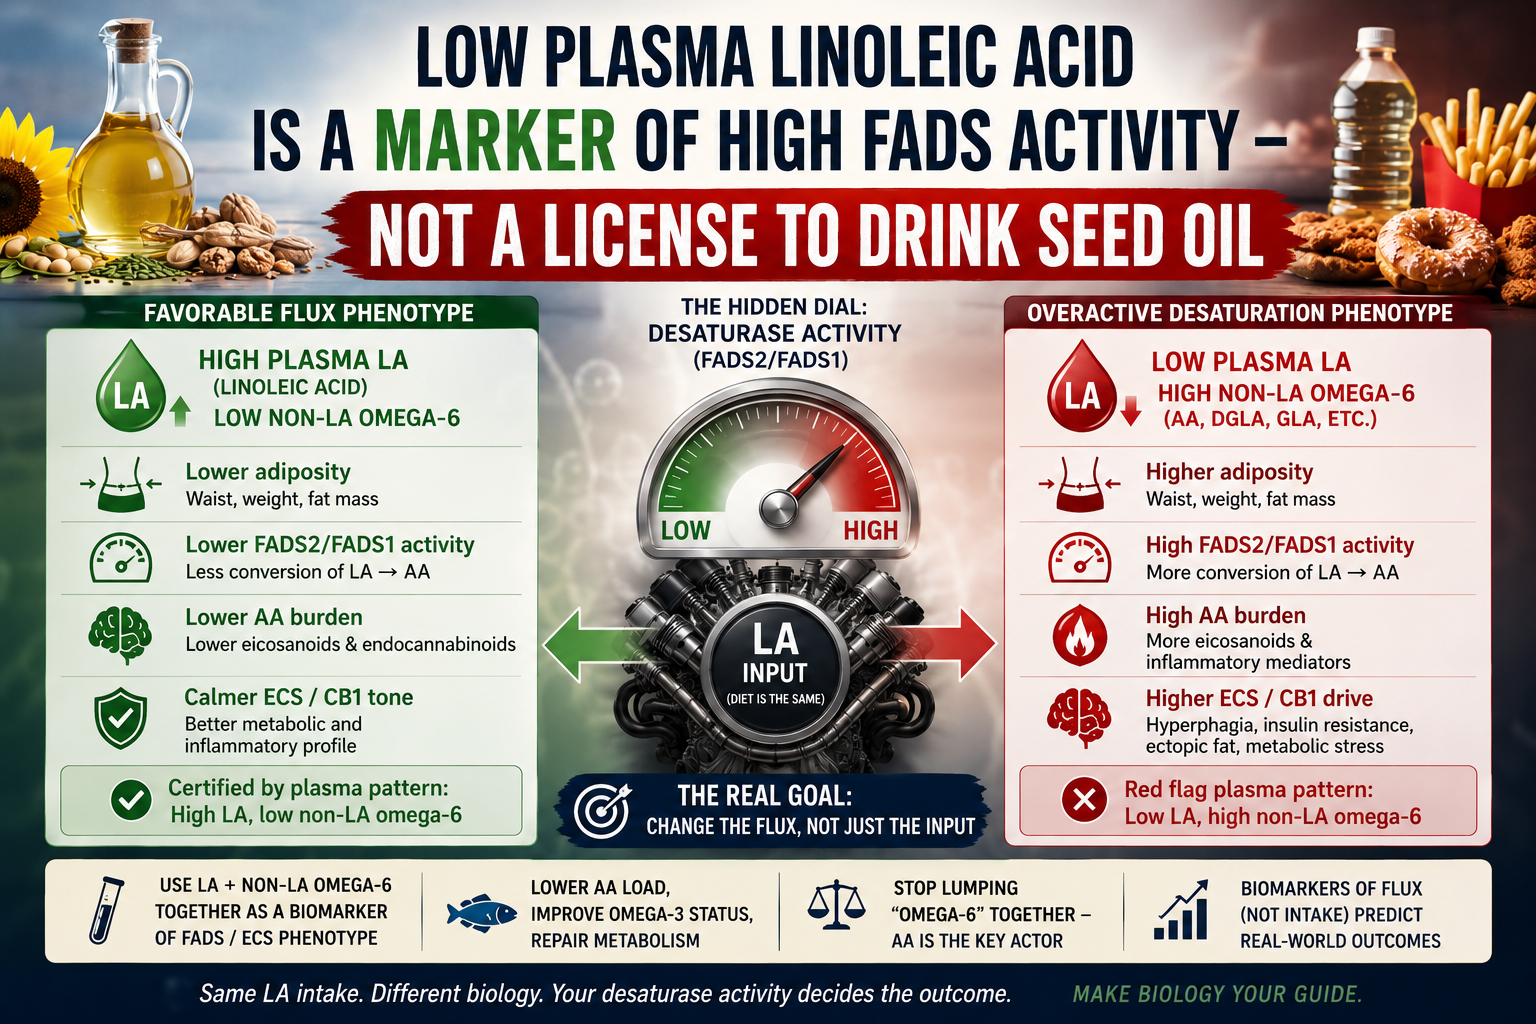
Imagine two people eating the same LA‑rich diet.
- Person A: lower FADS2/FADS1 activity, better insulin sensitivity, less chronic inflammation.
- They convert less of that LA into downstream AA.
- Their plasma shows higher LA %, lower non‑LA omega‑6.
- They tend to be leaner and have calmer ECS/endocrine tone.
- Person B: high FADS activity (genetics + metabolic state), low‑grade inflammation, adipose tissue already loaded with AA.
- They rapidly pull LA out of plasma into AA‑rich tissues.
- Their plasma shows lower LA %, higher non‑LA omega‑6.
- They’re heavier, more inflamed, more ECS‑driven.
Same input, different output. The hidden dial between them is desaturase activity (FADS2/FADS1) – exactly what the UK Biobank paper’s non‑LA signal is silently reporting.
In that context:
- High plasma LA is a marker of favorable flux.
- Low plasma LA is a marker of overactive desaturation and high AA.
You do not fix Person B by pouring more LA into an already overdriven FADS2/FADS1 system. That’s substrate on a fire.
FADS activity, arachidonic acid and endocannabinoid tone
The endocannabinoid system sits right in the middle of this flux.
- AA is the key precursor for 2‑AG and AEA, the main CB1 agonists.
- AA‑rich membranes + high FADS activity = higher endocannabinoid tone at baseline, especially in adipose and brain.
- Chronic CB1 overactivation drives exactly what we see in obesity: hyperphagia, reduced energy expenditure, ectopic fat deposition, impaired insulin signaling.
So when the UK Biobank paper finds:
it’s effectively tagging a high‑AA, high‑ECS‑tone phenotype, even though the authors never use that language.
Conversely:
is the signature of a system where LA is not being pushed aggressively into AA and CB1 ligands. That’s precisely the kind of substrate pattern we want when we talk about “CB1‑supportive” lipid status.
The problem is not linoleic acid per se; the problem is what your biology does with it.
Why more linoleic acid is not the right takeaway
Given all of this, the study’s suggestion that their findings “potentially support dietary recommendations to promote LA‑rich oils” is, at best, incomplete.
It might be harmless (or mildly beneficial) for:
- The metabolically healthy,
- With moderate FADS activity,
- On a background of good omega‑3 status and Mediterranean‑like fats.
But for:
- People with high FADS2/FADS1 activity,
- Already high AA/EPA ratios,
- Established obesity and insulin resistance,
the same advice is likely to fortify tissue AA pools and reinforce the very non‑LA signature the paper connects to higher adiposity.
In other words: this is precisely the population in which “more LA” looks a lot like more fuel for AA‑driven inflammation and CB1 overactivation.
From a mechanistic standpoint, the more sensible translation would be:
- Use plasma LA and non‑LA omega‑6 together as a desaturase/ECS phenotype.
- Target AA load and FADS activity (e.g., via omega‑3 repletion, diet quality, metabolic repair) instead of blindly boosting LA intake.
- Stop treating “omega‑6” as a single knob; start treating individual species – especially AA – as distinct actors.
Toward ECS‑centric, personalized omega‑6 interpretation
For ECS‑centric and personalized health approaches, this paper is actually helpful:
- It gives very large‑scale support to the idea that non‑LA omega‑6 (AA‑rich fraction) is where the metabolic risk is hiding.
- It shows that LA and non‑LA omega‑6 move in opposite directions with adiposity, reinforcing the need to separate them rather than lump them as “omega‑6.”
- It highlights how biomarkers of flux (like LA vs non‑LA pattern) are more informative than intake questionnaires.
The real question isn’t, “Is LA good or bad?” It’s:
“Given this person’s FADS activity, AA load, and ECS tone, what does their LA/non‑LA pattern tell us – and how do we change the flux, not just the input?”
That’s the level we need to operate on if we’re serious about using fatty‑acid biology to support CB1 and long‑term metabolic health, rather than just winning the next seed‑oil culture war.