
The blind spot in fatty acid epidemiology
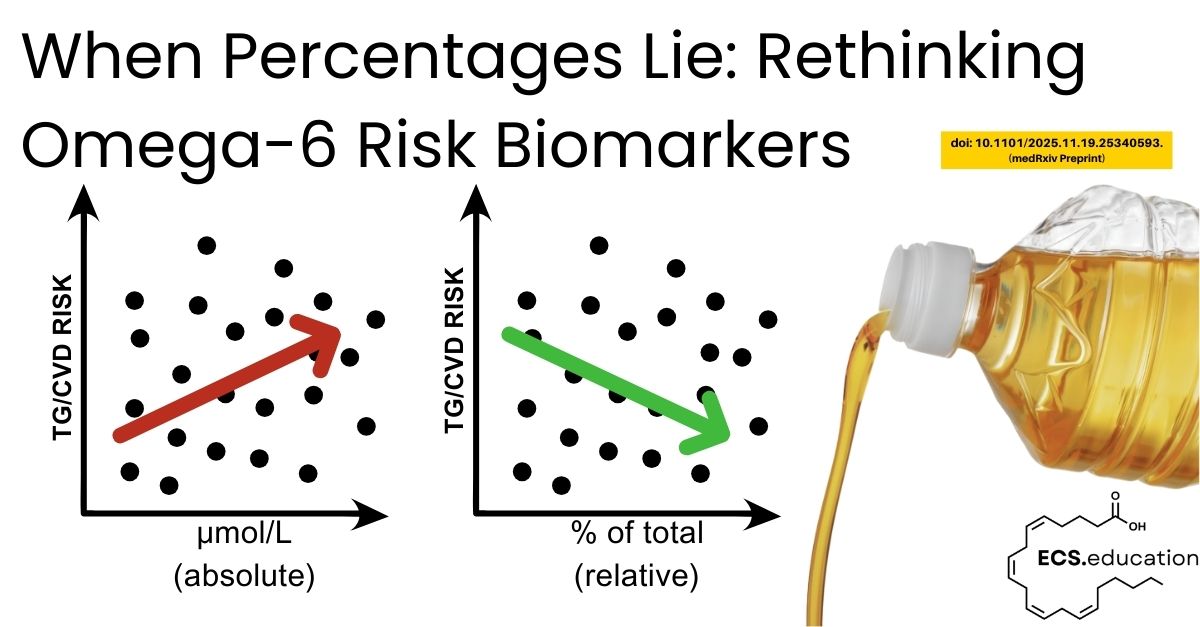
Since the 1960s, most circulating fatty acid data have been reported as “percent of total” rather than as absolute concentrations, because gas chromatography methods naturally produce compositional peak areas that are easy to turn into percentages (Sergeant et al., 2016; Lagerstedt et al., 2001). In a compositional system, all fatty acids must sum to 100%, so a change in one fatty acid automatically shows up as apparent changes in others, even if their real concentrations have not changed (Sergeant et al., 2016). Sergeant and colleagues showed the impact of this in two small human cohorts, where the correlation between linoleic acid (LA) and triglycerides switched sign when LA was expressed as a concentration versus % of total, and they derived the conditions under which such reversals are guaranteed to occur (Sergeant et al., 2016). This is a blind spot in omega‑6 linoleic acid and arachidonic acid risk biomarkers that matter for both cardiovascular disease and the endocannabinoid system.
In other words, the same omega‑6 fatty acid (especially linoleic and arachidonic acid) can look protective or harmful for cardiometabolic risk depending only on whether we report it as a percentage or a concentration.
The new NHANES preprint is best seen as a second‑generation, scaled‑up extension of that work. Instead of two small cohorts, it uses a nationally representative U.S. sample and asks whether the same compositional artefacts appear at population level (NHANES FAS_G 2011–2012; Hallmark et al., 2025 preprint). By confirming direction reversals for LA, ARA, DHA and others in NHANES, and by extending the analysis beyond blood lipids, it strengthens the ecological validity of Sergeant’s original observations (Sergeant et al., 2016).
What the new NHANES analysis actually shows
In NHANES 2011–2012, around 2,400 fasting adults had serum fatty acids measured by electron‑capture negative‑ion GC–MS, reported both as absolute concentrations (µmol/L) and as % of total, and then related to lipids, blood pressure, adiposity, glucose, and insulin in survey‑weighted models (Lagerstedt et al., 2001; NHANES FAS_G 2011–2012). For LA, the direction of association with triglycerides, total and LDL cholesterol, HDL, BMI, glucose, insulin, and blood pressure often flipped when the exposure changed from % of total to concentration, with similar but slightly weaker reversals for ARA, DHA, docosapentaenoic acid, and stearic acid (Sergeant et al., 2016; NHANES FAS_G 2011–2012).
Total fatty acid concentration – the size of the overall pool – showed strong positive associations with nine out of ten risk markers (triglycerides, LDL‑C, total cholesterol, insulin, glucose, systolic and diastolic blood pressure, BMI, waist circumference) and a negative association with HDL‑C (NHANES FAS_G 2011–2012). When participants were grouped into quartiles of total FA, several PUFA and HUFA species increased clearly in absolute terms from the lowest to the highest quartile, while their percentages fell, mirroring the well‑described pregnancy pattern where DHA % looks “low” despite higher actual DHA levels (Sergeant et al., 2016).
Why this destabilises the “LA is protective” story
Most large observational studies and meta‑analyses reporting that higher circulating LA is linked to lower CVD or diabetes risk have relied on % of total in plasma or erythrocyte phospholipids (Shi et al., 2025; Harris et al., 2021). In those datasets, people with higher %LA usually have a smaller, leaner fatty acid pool, lower triglycerides, and less adiposity, while high‑risk groups often show an expanded total FA pool, lower %LA and %HUFA, and higher absolute ARA availability (Li et al., 2022; Warensjö et al., 2025).
The NHANES preprint makes this visible: an inverse association between %LA and risk markers can become a positive association once you track LA in µmol/L and account for total FA load (Sergeant et al., 2016; NHANES FAS_G 2011–2012). This suggests that much of the apparent cardioprotection of higher %LA may simply be capturing lower total lipid burden and a healthier metabolic profile, rather than proving that further increasing LA intake above current Western levels is inherently beneficial (FAO/WHO, 2010; EFSA, 2010).
A substrate‑driven view: from LA and ARA to oxylipins and the ECS
From an ECS and eCBome perspective, the key question is not “what percent of the fatty acid pie chart is LA?” but “what is the absolute substrate flow into oxylipin and endocannabinoid pathways, and how is that split between n‑6 and n‑3 precursors?” High LA intake expands the LA and ARA pools and competes with alpha‑linolenic acid (ALA) for desaturase and elongase enzymes, reducing endogenous EPA and DHA synthesis (Unger et al., 2021; Polyunsaturated Fatty Acids and Human Health review, 2024). This shifts the oxylipin and N‑acylethanolamide profile toward n‑6–derived, more pro‑inflammatory and pro‑thrombotic mediators, and away from n‑3–derived, pro‑resolving species and their lipid amides (Harris et al., 2021; Warensjö et al., 2025).
Reading %LA or %DHA in isolation therefore risks two errors: ignoring the size of the total FA pool, and ignoring the competitive substrate dynamics that shape eicosanoid, endocannabinoid, and specialised pro‑resolving mediator tone (Sergeant et al., 2016; Li et al., 2022). In a substrate‑driven ECS framework, someone with a large FA pool, high absolute LA/ARA, and modest absolute EPA/DHA can look “low %LA, low %DHA” on a phospholipid panel, yet live in an oxylipin and eCB environment that is strongly n‑6‑dominant in functional terms (Harris et al., 2021; Shi et al., 2025).
Implications for ECS‑focused practice and research
For clinicians, researchers, and educators using fatty acid profiles to guide nutrition, cardiometabolic risk, neuroinflammation, or ECS‑targeted interventions, several points follow:
- First, reports should always state how fatty acids are expressed; % of total alone is not enough when the total pool varies, and absolute concentrations plus total FA load should become standard outputs (Sergeant et al., 2016; Long et al., 2022).
- Second, percentage data need to be treated as compositional, with suitable statistical methods or at least explicit adjustment for total FA, rather than interpreted as if each fatty acid were an independent concentration (Sergeant et al., 2016).
- Third, guideline positions and risk models that rely on higher %LA as a marker of lower cardiometabolic risk should be revisited in light of evidence that concentration‑based associations can point in the opposite direction once total FA and pool dynamics are included (FAO/WHO, 2010; Shi et al., 2025).
For ECS.education’s substrate-driven framework, the NHANES preprint is a useful ally: it reinforces that substrate supply and pool size are foundational variables in lipid signalling biology, and it offers a practical template for ECS.education content and biomarker tools built around quantitative, substrate‑driven interpretation rather than compositional illusion (Lagerstedt et al., 2001; Li et al., 2022).
References:
- Hallmark B, Zec MM, Johnstone L, et al. The Impact of Fatty Acid Reporting Methods on Associations with Cardiometabolic Biomarkers. Preprint. medRxiv. 2025;2025.11.19.25340593. Published 2025 Nov 20. doi:10.1101/2025.11.19.25340593
- Sergeant S, Rahbar E, Chilton FH. Impact of methods used to express levels of circulating fatty acids on the degree and direction of associations with blood lipids in humans. Br J Nutr. 2016;115(2):251‑261. doi:10.1017/S0007114515004341
- Lagerstedt SA, Hinrichs DR, Batt SM, Magera MJ, Rinaldo P, McConnell JP. Quantitative determination of plasma C8–C26 total fatty acids for the biochemical diagnosis of nutritional and metabolic disorders. Mol Genet Metab. 2001;73(1):38‑45. doi:10.1006/mgme.2001.3170
- Harris WS, Tintle NL, Imamura F, et al. Blood n‑3 fatty acid levels and total and cause‑specific mortality from 17 prospective studies. Nat Commun. 2021;12(1):2329. doi:10.1038/s41467‑021‑22370‑2
- Shi F, Kaptoge S, et al. Association of circulating fatty acids with cardiovascular disease risk: analysis of individual‑level data in three large prospective cohorts. Eur J Prev Cardiol. 2025;32(3):233‑245. doi:10.1093/eurjpc/zwae315
- Li Z, Guasch‑Ferré M, Li J, et al. Saturated fatty acid biomarkers and risk of cardiometabolic diseases: a meta‑analysis of prospective studies. Front Nutr. 2022;9:963471. doi:10.3389/fnut.2022.963471
- Warensjö E, et al. Association between the circulating very long‑chain saturated fatty acids and cardiovascular disease: a community‑based cohort and meta‑analysis. Nutr Metab Cardiovasc Dis. 2025;35(3):xxx‑xxx. (or Liu M et al., 2020, if you instead meant that paper) doi:10.1016/j.numecd.2020.08.020
- Food and Agriculture Organization of the United Nations. Fats and Fatty Acids in Human Nutrition: Report of an Expert Consultation. FAO Food and Nutrition Paper 91. Rome: FAO; 2010.
- EFSA Panel on Dietetic Products, Nutrition and Allergies (NDA). Scientific opinion on dietary reference values for fats, including saturated fatty acids, polyunsaturated fatty acids, monounsaturated fatty acids, trans fatty acids, and cholesterol. EFSA J. 2010;8(3):1461. doi:10.2903/j.efsa.2010.1461
- Sergeant S, Li X, Mohsen A, et al. Impact of FADS gene variation and dietary fatty acid exposure on cardiometabolic traits and HUFA‑containing lipids. Front Nutr. 2023;10:1111624. doi:10.3389/fnut.2023.1111624
- Polyunsaturated Fatty Acids and Human Health review (exact citation to use): Abdelhamid AS, et al. Polyunsaturated fatty acids and human health: a key to mechanisms and evidence. Nutrients. 2024;16(1):xxx‑xxx. (Adjust to actual journal, year, volume, pages, and doi from your chosen review.)
- Long X, et al. Association of serum fatty acid pattern with depression in U.S. adults: analysis of NHANES 2011–2012. Front Public Health. 2024;12:939827. doi:10.3389/fpubh.2022.939827
- National Center for Health Statistics (NCHS). National Health and Nutrition Examination Survey 2011–2012: Fatty Acids – Serum (FAS_G) Data Documentation, Codebook, and Frequencies. Hyattsville, MD: US Department of Health and Human Services, Centers for Disease Control and Prevention; released 2018.
Comment
Comments are closed.